Custom waveforms using EasyWave and CSV Templates
October 23, 2017
Arbitrary waveform generators (AWGs) are programmable voltage sources. They can be extremely useful tools when your application requires the output of waveforms that contain complicated features or shapes. Many AWGs come pre-loaded with arbitrary waveforms like cardiac, voice, and a host of trigonometric functions. These “built-in” waveforms can be useful, but the real power of an AWG is the ability to build custom waveforms.
In many cases, AWGs have basic software packages that allow you to create and edit simple waveforms by applying simple mathematics to basic wave shapes like Sine or Square waves. This technique is useful when you are building composite waveforms using basic shapes or if you wish to “hand draw” a waveform, but what if you want to create or edit a more complicated waveform?
Most AWGs can be programmed directly using a remote computer connection, USB or Ethernet connection from the computer to the instrument, and a software package that can communicate to the instrument. Some common programs include.NET, Python, and LabVIEW. While this configuration is extremely powerful, it is cumbersome to develop quickly. To send a custom arbitrary waveform you need to build the application and deal with formatting the arbitrary waveform before you can get actually start using the AWG for the intended application.
In this application note, we are going to describe a simple method of creating a custom arbitrary waveform by creating a Comma Separated Variable (CSV) template, edit and save the CSV file, and finally how to transfer the CSV file to a SIGLENT SDG2000X series arbitrary waveform generator. The theory can then be applied to any generator that has a similar arbitrary waveform generator software package.
Create an EasyWave Template
The SIGLENT SDG series of arbitrary waveform generators work with the EasyWave software package.
- To begin, download and install the EasyWave package that matches your generator. This can be found on your favorite SIGLENT website (www.siglenteu.com)
You can also download a PDF and example Excel templates here: EasyWaveCSV
- Open EasyWave by clicking on the EasyWave desktop icon:

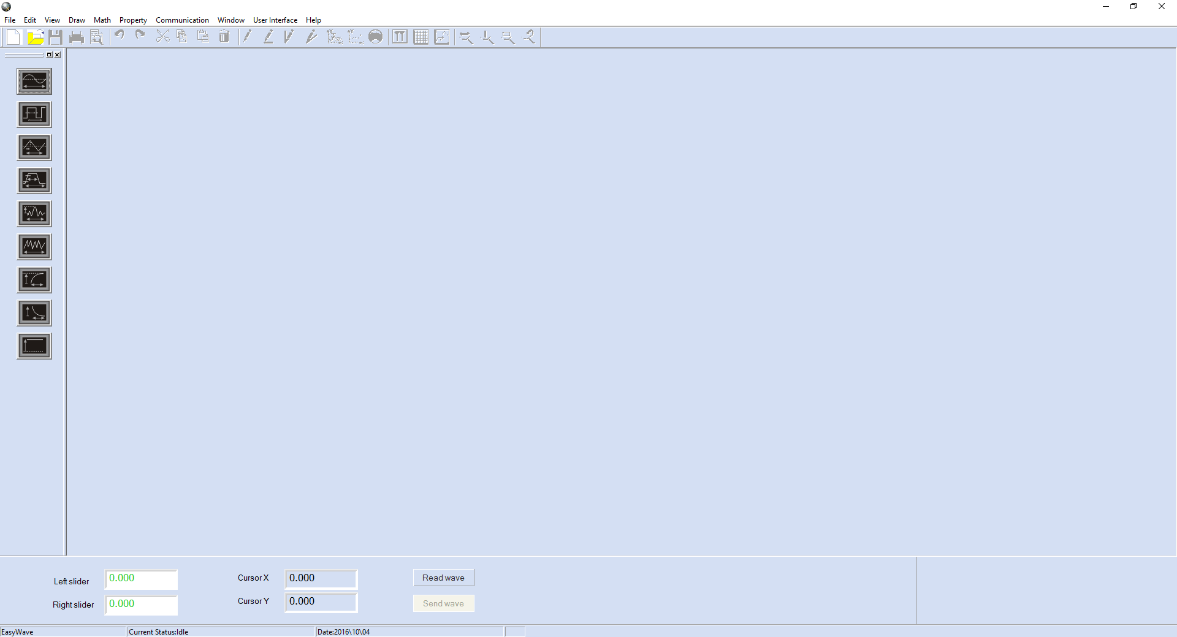
- Here is the EasyWave user interface
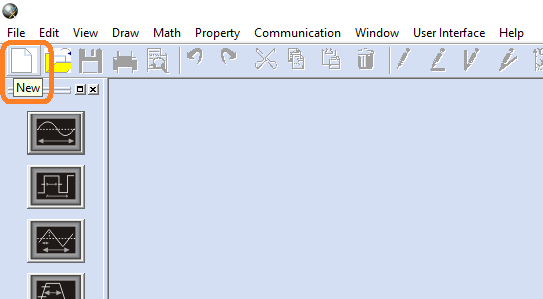
- Create a new waveform by clicking on Edit > New
- Enter the waveform name, instrument (if SDG2000X), and waveform parameters in the next window:
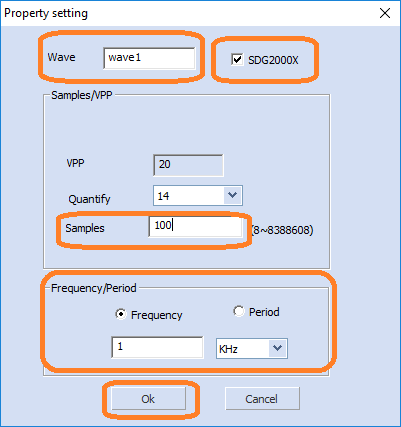
NOTE: Set the number of samples based on the resolution and the output sample rate that your application requires. A good starting point is to use 10 data points for the shortest feature you wish to create.
Keep in mind that more data points will deliver higher resolution in the time domain. This will then determine the overall output sample rate for the waveform. Once you have set the sample rate, you can then determine the number of points required to create your waveform.
For example, if the smallest feature of a waveform is a 10 us pulse, and you use 10 points to reproduce it, then the sample rate must be set to 1us/point.
10 us/10 point= 1 us/point
If you need 10 ms of total waveform length, then the waveform requires 10,000 points:
10 ms/(1 us/point) = 10,000 points
The SDG2000X is the only SIGLENT AWG that has flexible memory depth at this time.
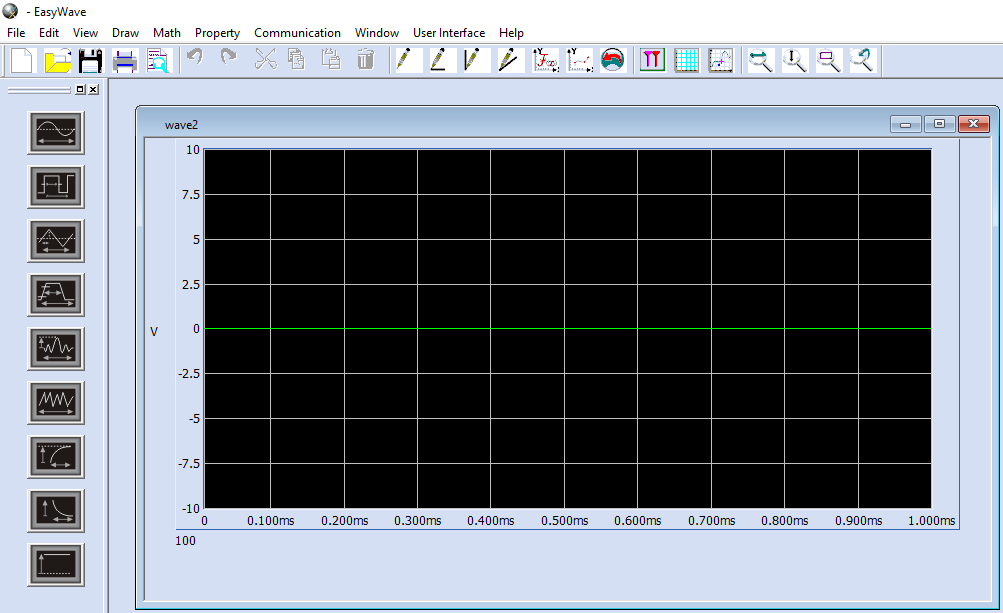
- Now, the waveform edit window opens and shows a simple DC waveform centered at 0 V.
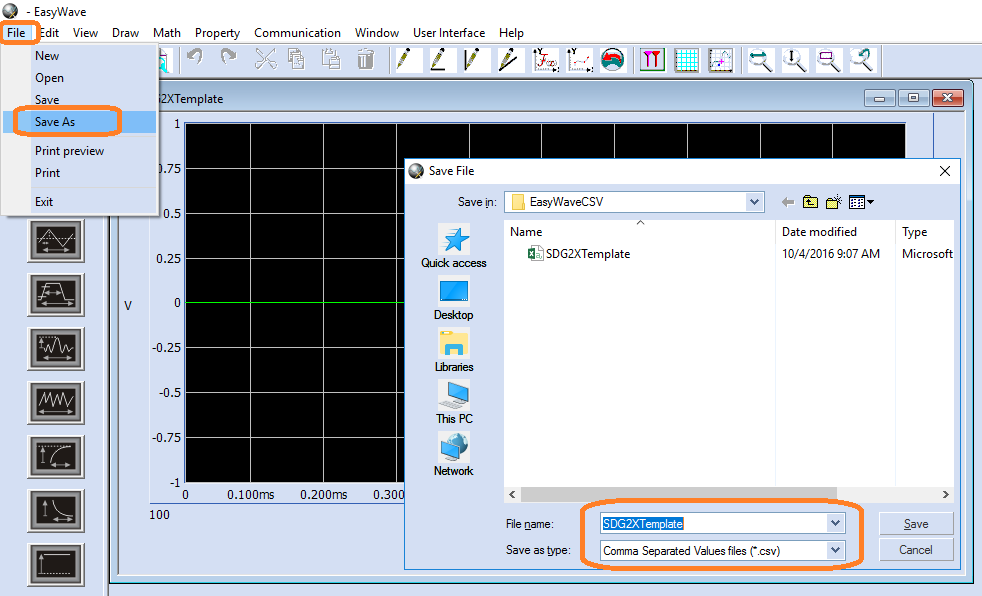
- Save the file as a CSV by pressing File > Save As > set the file location and name. If you are using an SDG2X, you can also directly open the SDG2X template file that is available with this application note
Editing an EasyWave Template
Once you have saved a template as a CSV, you can edit and reuse it anytime you need to create a new waveform.
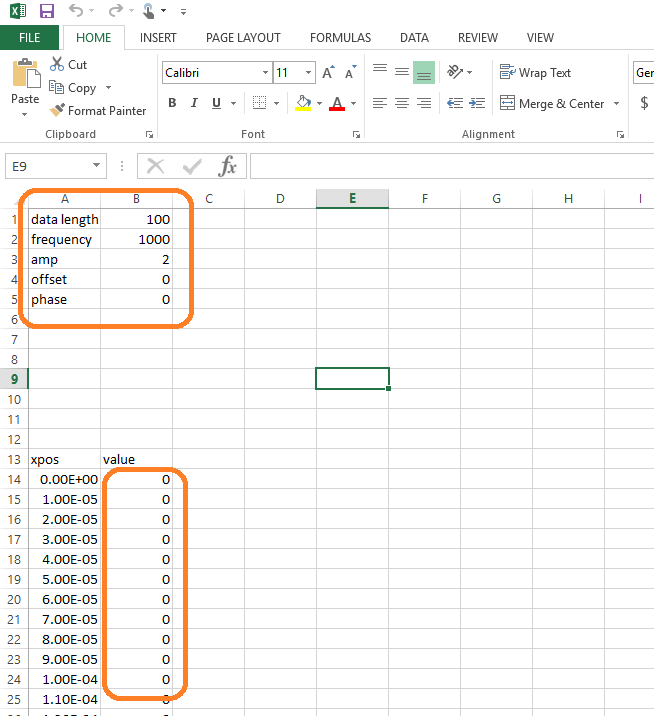
- Open the template file using a CSV capable spreadsheet program like Microsoft Excel©. You can edit the data length, frequency (Hz), amplitude (Volts), offset (Volts), and phase values (degrees) in the file. Note that the data length cannot be easily changed on the front panel of the instrument.You can edit the data manually, or use a program like Mathematica or Matlab to write to the template cells directly.
The actual voltage values in column B represent the true output value of the instrument. If the instrument output is set lower than the maximum value in the value list, all output data will be scaled to the instrument setting.
- After you have built the waveform, save the Excel file as a CSV. Use a specific name to indicate the waveform type and output sample rate or another useful identifier.
NOTE: There are some things to keep in mind when creating your waveform:
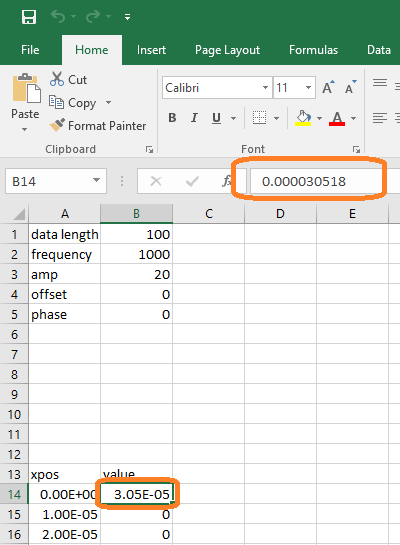
1. The data format in each field must match the parameter for your instrument requirements. For example, the SDG2X has 16-bit amplitude resolution, but other models have 14-bits.
216 = 65,536 counts 214 = 16,384 counts
For a 16-bit generator with a 20 Vp-p waveform amplitude, the minimum voltage step size is given by the following:
20 V/65,536 = 3.0518E-4 V
For a 14-bit generator with a 20 Vp-p waveform amplitude, the minimum voltage step size is given by the following:
20 V/16,384 = 1.2207E-3 V
2. Use the exponential or long version of the data as shown below:
3. The data length value (cell B1) must match the total number of points in the column labeled value that starts at column B, row 14.
Using an EasyWave CSV File
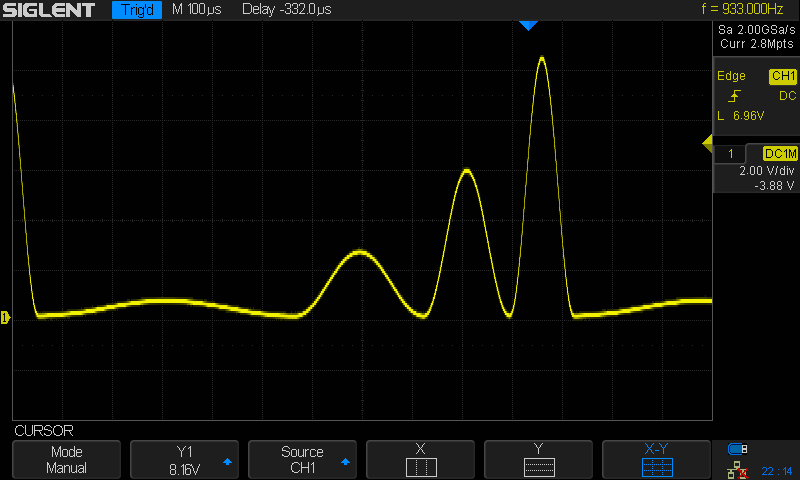
After editing and saving your waveform, you can recall it into EasyWave and verify the output using an oscilloscope. AWGs are very flexible and easy-to-use, but visual verification is recommended to ensure that the output is correct before you connect the AWG to your circuit.
- Power on the SDG and connect the USB or Ethernet cable to the controlling remote computer
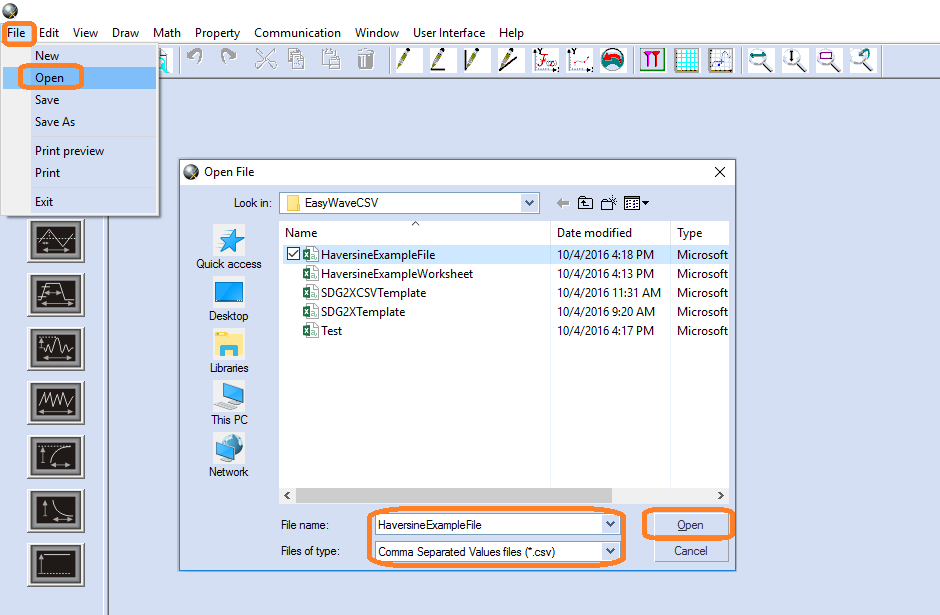
- Start Easywave and open the CSV file that you wish to download to the instrument by pressing File > Open as shown below:
- Verify that the waveform shape matches your expected output. Remember, you can adjust the amplitude and frequency on the AWG if either are not correct.
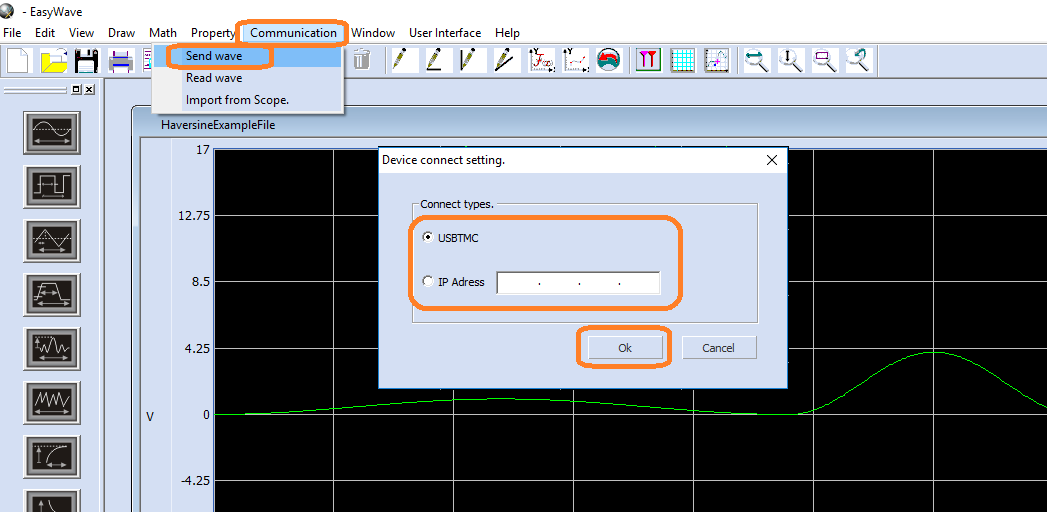
If the waveform is correct, download the wave by selecting Communication > Send Wave > and select USBTMC for USB or enter the IP address for LAN/Ethernet communications to the instrument:
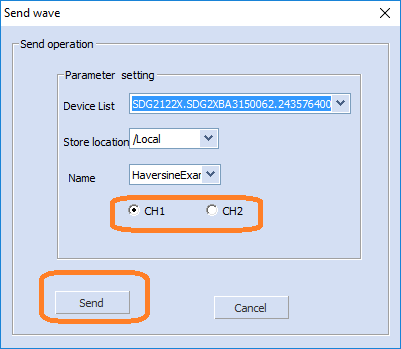
- Select the channel that you wish to control and press send
- Verify and, if needed, adjust the output voltage and frequency/sample rate by connecting the AWG to an oscilloscope
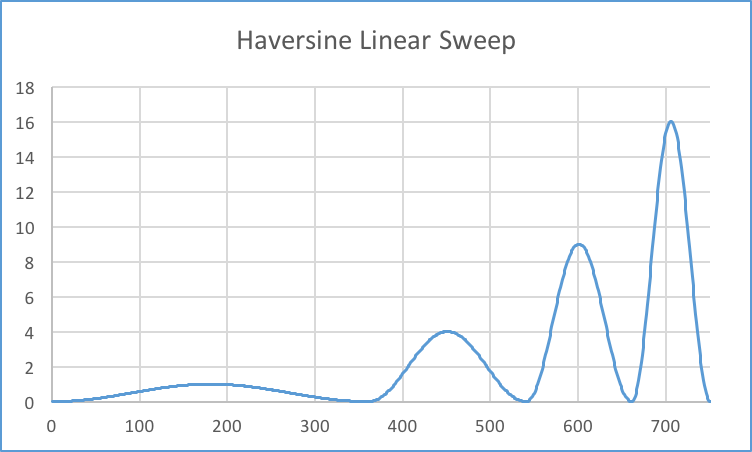
Here is an example in Excel in which we manually built a function with sweeping amplitude and frequency Haversines.
First, the Haversine waveform:
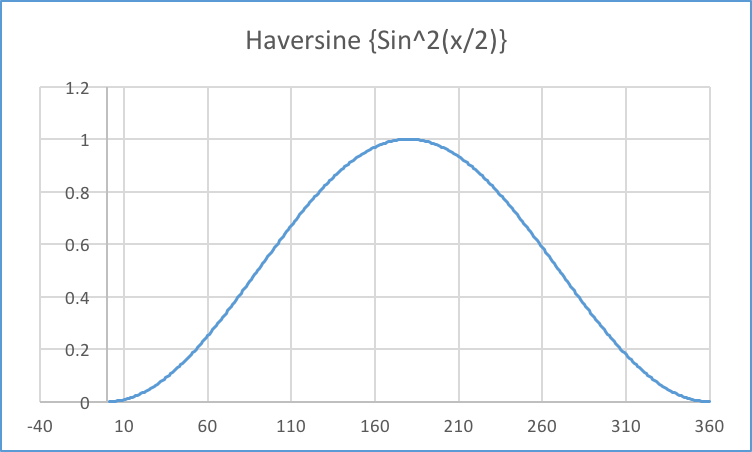
Haversine(x) = sine2(x/2)
You can build a column of data in Excel that represents a single Haversine function. Next, you can create the sweep by adding multipliers to the amplitude and frequency portions of the Haversine function:
SweepHaversine2(x) = 2*sine2(2x/2)
SweepHaversine3(x) = 3*sine2(3x/2)
SweepHaversine4(x) = 4*sine2(4x/2)
In this example, we use this technique to build a sweep with increasing amplitude and decreasing frequency, as shown below:
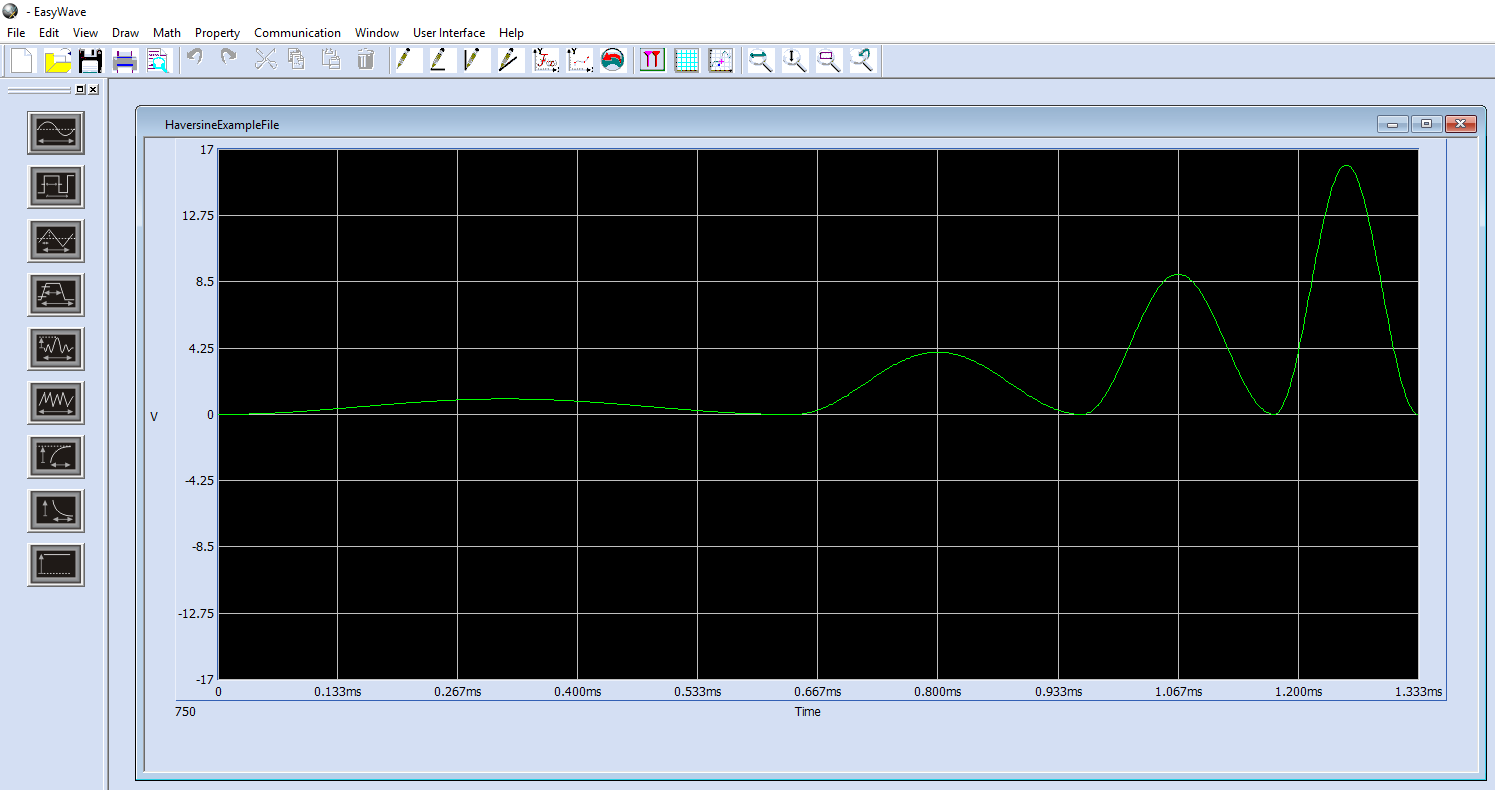
Once we have built the column of data, simply open the CSV template, copy-and-paste the column of new data into the CSV template, adjust the template data points to match the new data length, and save the file as a CSV with a new name.
Reopen the new CSV using EasyWave and verify that it matches the application:
Now, download the file to the instrument. The front panel of the AWG will indicate that the waveform is an ARB and will have a picture representing the new waveform on the front panel:
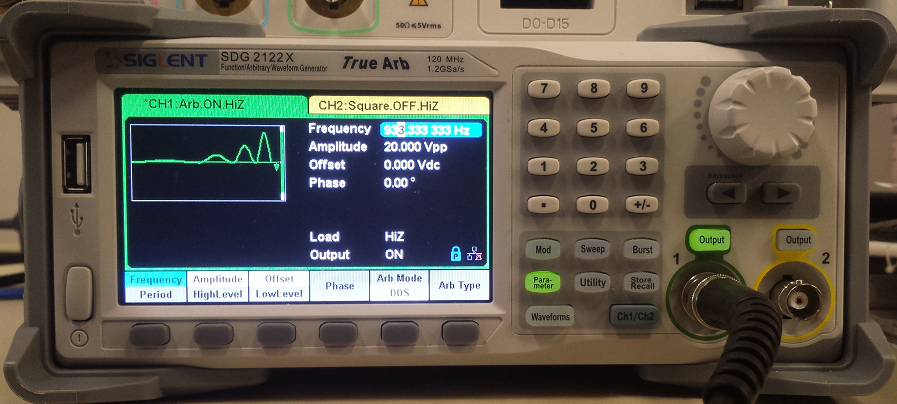
Connect the AWG channel to an oscilloscope and verify that it meets the application requirements. You can adjust the waveform amplitude, frequency, Arb Mode, and other features from the front panel of the AWG if it requires fine-tuning.