Bode Plot of a filter using an oscilloscope and function generator
February 26, 2019
A Bode plot is a method of graphically displaying the frequency response of a system or device-under-test (DUT). Commonly, the magnitude and phase response of the device are plotted with respect to frequency using a shared horizontal frequency axis as shown in the example below:
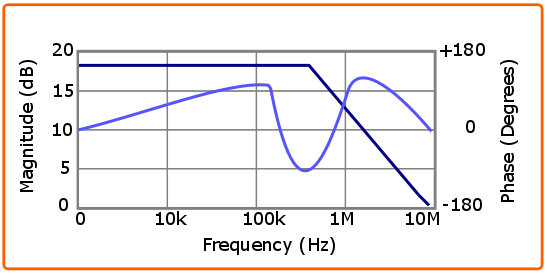
By showing both the magnitude and phase information on the same graph, you can evaluate some of the tested device’s basic qualities. A function generator and oscilloscope can be used to manually collect and compare the phase and amplitude data for a given device, but this can be tedious and time-consuming.
In this application note, we are going to characterize the frequency response of a low pass filter using the free automated Bode Plot function SIGLENT SDS10004X-E oscilloscope (SDS1204X-E, to be precise) and a SIGLENT SDG6000X Series (SDG6052X) arbitrary waveform generator. This automated control provides a clean and easy route to characterizing devices.
The Bode function is also included with SDS1104X-E, SDS1204X-E, SDS2000X-E, SDS2000X Plus, SDS5000X, and SDS6000A series oscilloscopes.
There is also a video covering this topic:
Let’s take a look at the required hardware.
Hardware:
- Qty 1 SIGLENT SDS1004X-E series four-channel oscilloscope. In this note, we will use a 200 MHz version (SDS1204X-E). The important thing to keep in mind is that the maximum bandwidth of the scope exceeds the maximum frequency we wish to measure. Remember that the maximum frequency shown on an on oscilloscope datasheet is usually the 3 dB point!
- Qty 1 SIGLENT SDG series function generator. In this note, we are using a 500MHz SDG6052X, but any SDG series (800/1000, 1X, 2X, 6X) can communicate via USB cable to an SDS1004X-E series of four- channel scopes. Just be sure that the maximum sine wave output frequency meets or exceeds your DUT requirements. Note, we could also use the X-E external function generator (part number SAG1021). It can provide up-to 25 MHz sine waves and can be used for Bode Plotting as well.
NOTE: The SAG1021 has only 1 output and requires a BNC “T” to create the direct and through connections to the scope.
- Qty 1 USB cable: For communication between the generator and scope
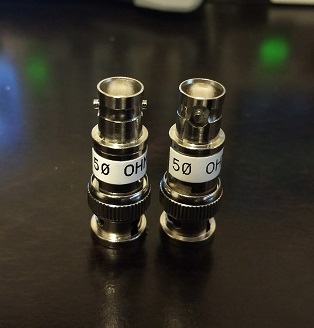
- Qty 2 50 Ohm BNC terminations: Matches the DUT impedance (50 Ohms) to the high impedance inputs of the scope (the X-E models do not have 50 Ohm inputs):
- Qty 3 BNC coaxial cables: Connect SDG out to DUT and the oscilloscope
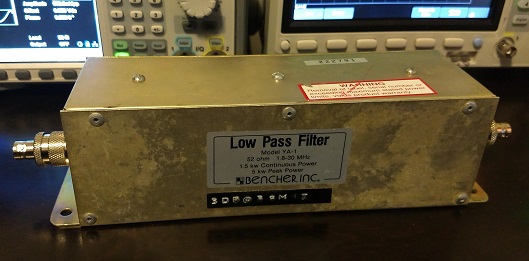
- Qty 1 DUT (Device-under-test): We are going to test a 50 Ohm 30 MHz low pass filter:
Connections:
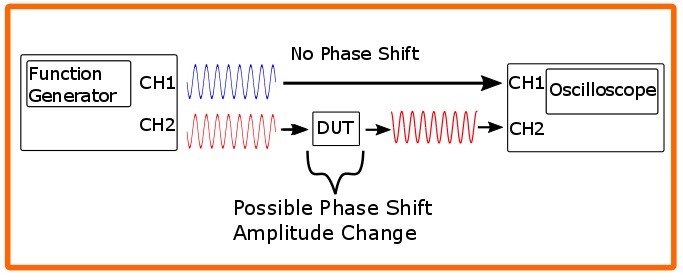
In this measurement, we want to see how the DUT affects a known signal’s amplitude and phase. One method to accomplish this involves sourcing two pure sine waves with identical amplitude and starting phase values. One of the signals is wired directly to an oscilloscope input (the “control” or “direct” signal). The second output (identical to the first) goes through the DUT and then to the scope. The DUT may affect the signal amplitude and phase. We can easily compare the two signals using the measurements performed with the scope and graph the amplitude and phase changes with respect to the input signal frequency.
Here is a simplified diagram of the test methodology:
Physical Connections:
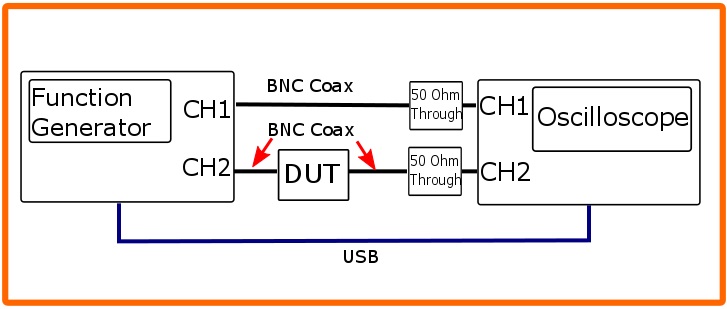
- Connect the SDG X series Generator CH1 Output > BNC cable > BNC 50 Ohm termination > SDS1204X-E Oscilloscope CH1 input
- Connect the SDG X series Generator CH2 Output > Appropriate cable > DUT input
- DUT output > appropriate cable > BNC 50 Ohm termination > SDS1204X-E Oscilloscope CH2 input
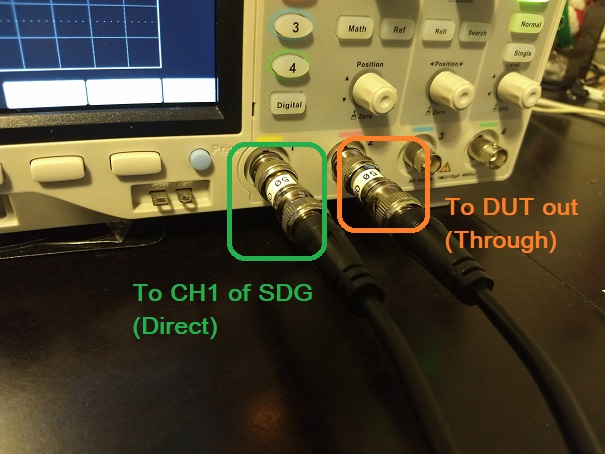
Here is a close up of the 50 Ohm terminators on the scope:
- SDG X series Generator > USB Cable > SDS1204X-E Oscilloscope USB control (either front or rear USB location will work. Rear as shown below)
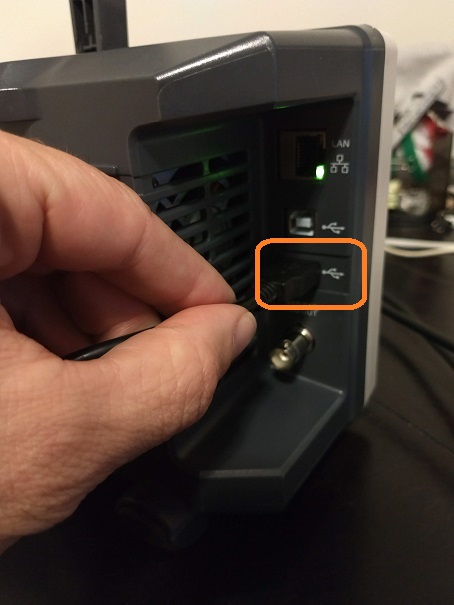
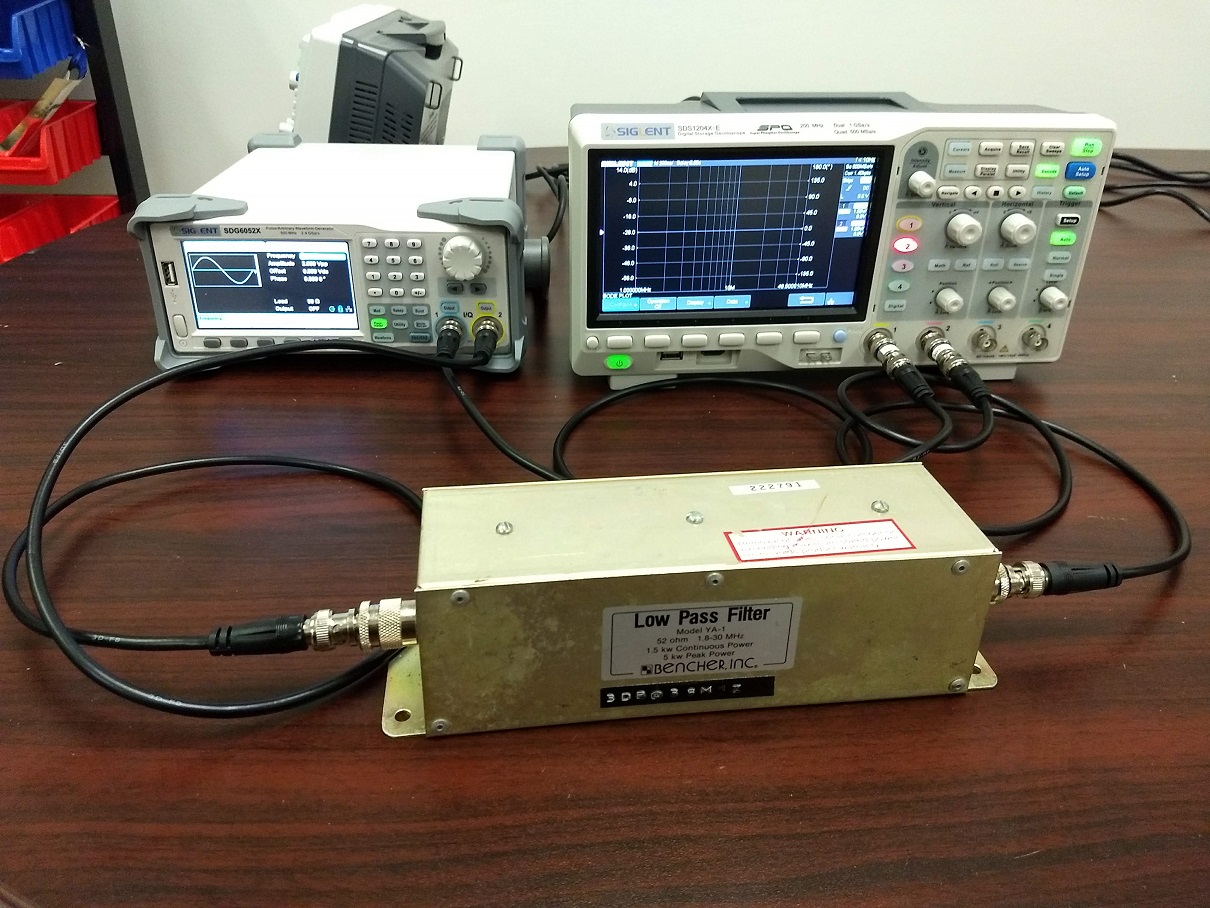
Here is a picture after the connections are complete (NOTE the USB cable between instruments is hidden):
Configure and Run:
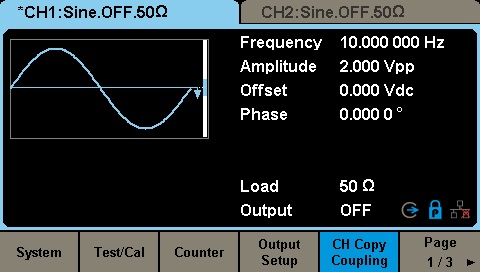
First, let’s configure the generator so that CH1 and CH2 are identical signals and start simultaneously. The SIGLENT SDG X series of generators feature a handy tracking feature that forces the settings and actions on CH1 to be mirrored on CH2.
To enable Tracking:
- Press Utility > CH Copy Coupling (Page 1/3)
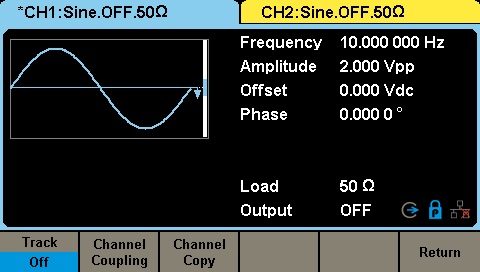
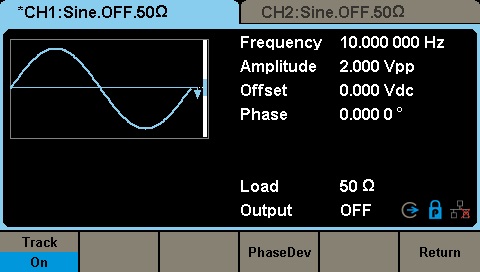
2. Set Tracking > ON
Now, we can go back to the oscilloscope and configure the sweep parameters and run the test.
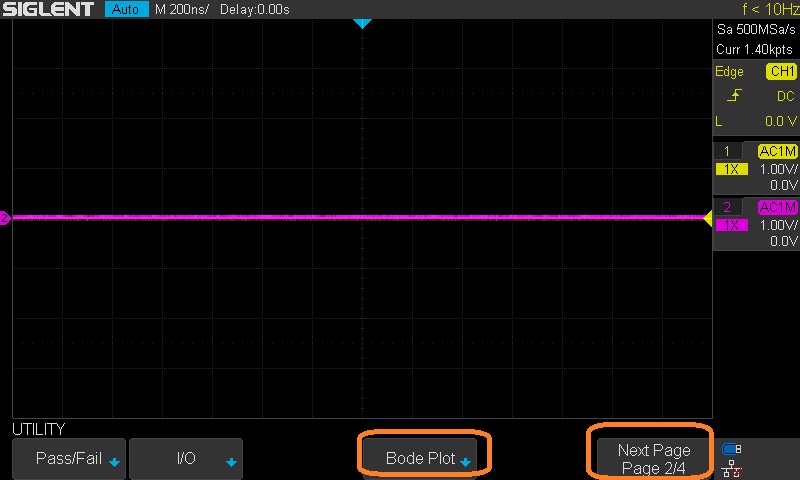
- On the front panel of the scope, press Utility > and arrow down until you get to page 2 > Select Bode Plot
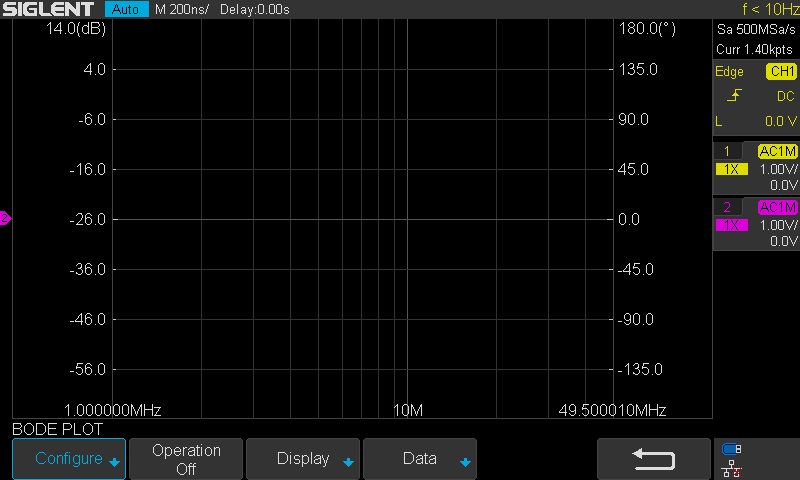
This opens up the Bode Plot menu:
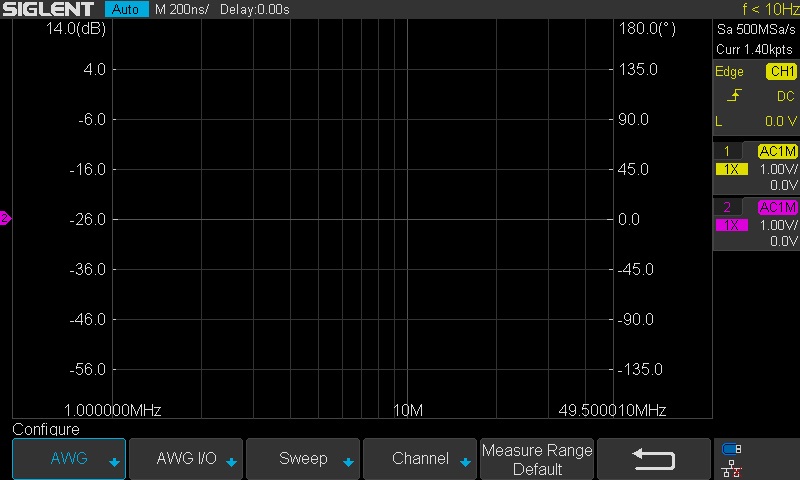
2. Press Configure to open up the generator Configure (AWG) controls and sweep parameters:
3. Press AWG to set the signal amplitude and set the expected device load impedance. Press the back arrow to return to the Configure screen.
4. Press Sweep to open the Sweep menu. Here, you can set the mode, sweep start/stop frequencies, and resolution:

To set the Start and Stop frequencies, press the appropriate soft key (Start or Stop).
You can change the input value by rotating the intensity knob.
Alternately, you can press the intensity knob to display the unit’s keyboard.
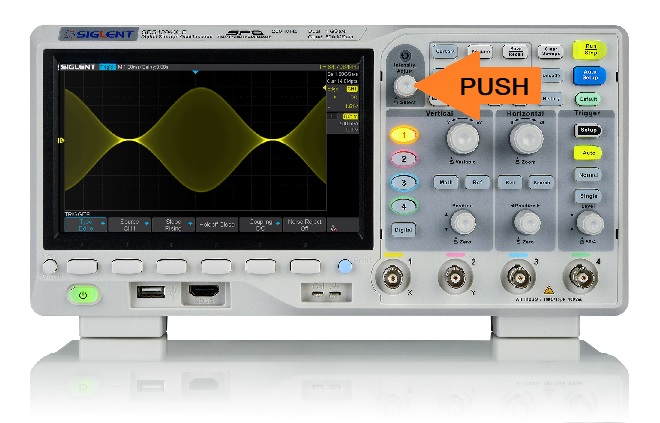
Now, rotate the knob to highlight a character or unit and press the knob to enter:
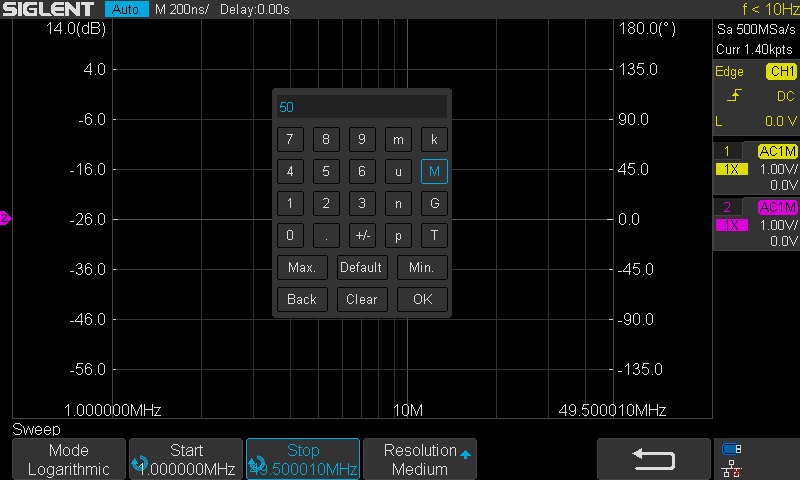
6. Press the back arrow to return to the Configure screen.
7. Now, confirm the channel connections by pressing Channel:
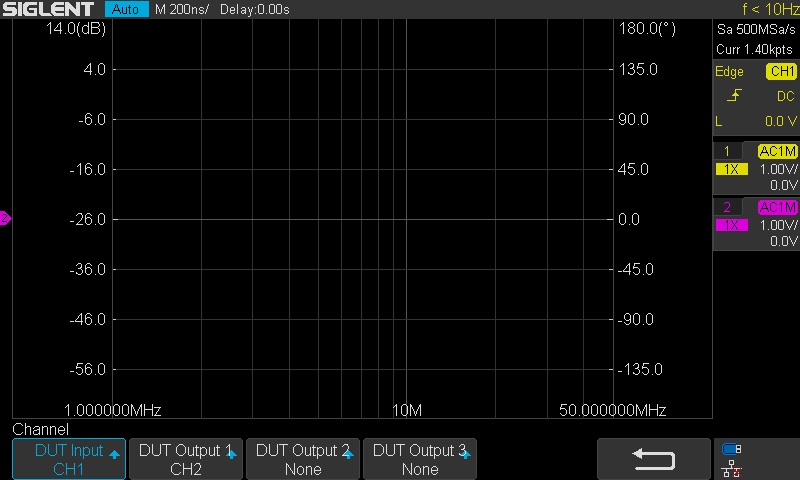
Here, you can see we have DUT input (the direct signal from the generator) connected to Oscilloscope channel 1. The scope CH2 is connected to the DUT output (the through connection).
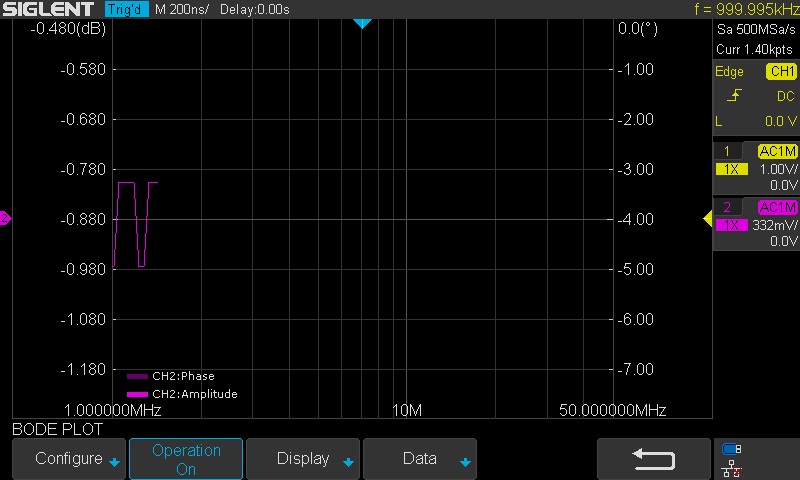
8. Back arrow twice to get to the Bode Plot screen. Now, you can set Operation = ON to run the test:
- The generator outputs should be enabled and the frequency values will start to change as the generator sweeps the output
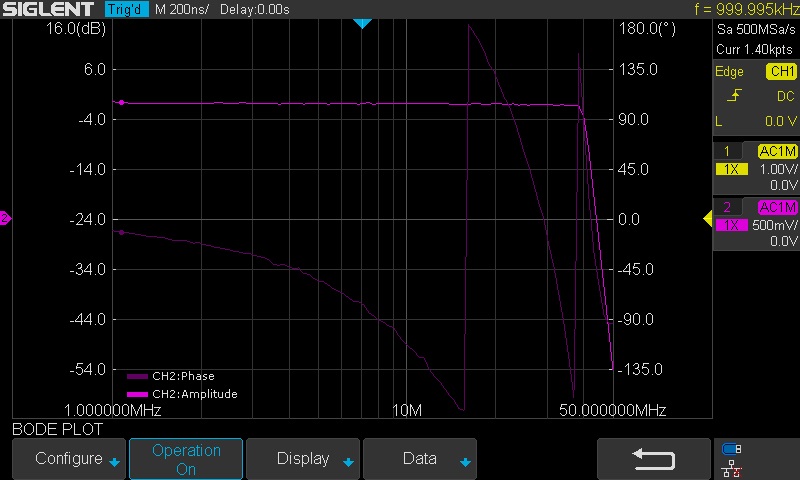
- The oscilloscope will begin to plot the amplitude and phase vs. frequency as shown (Since we selected scope input CH2, the Phase is dark pink. Amplitude is light pink. Data from CH1 has shades of yellow. CH3 data has shades of blue. CH4 data has shades of green):
As the data is collected, there may be some range changing..
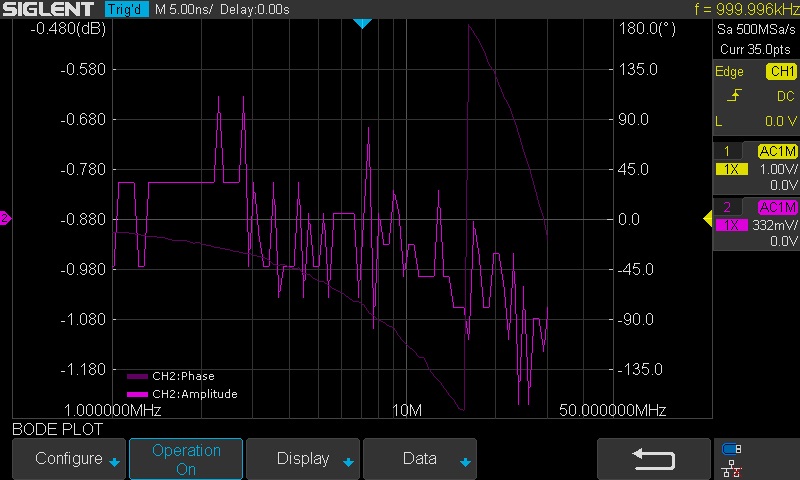
Finally, the sweep is complete.. we can see data from the start to the stop frequency:
Now, you can print a picture of the display or you can open up the list table to see each data point by pressing Data:
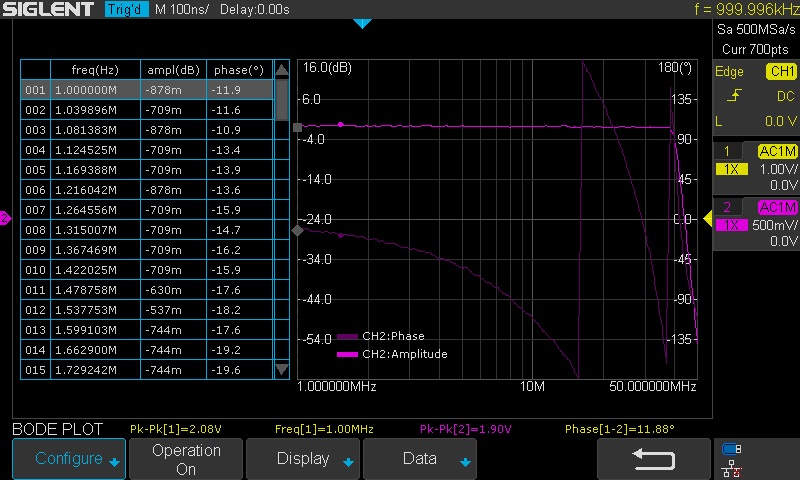
From the Data menu, you can enable the list view:
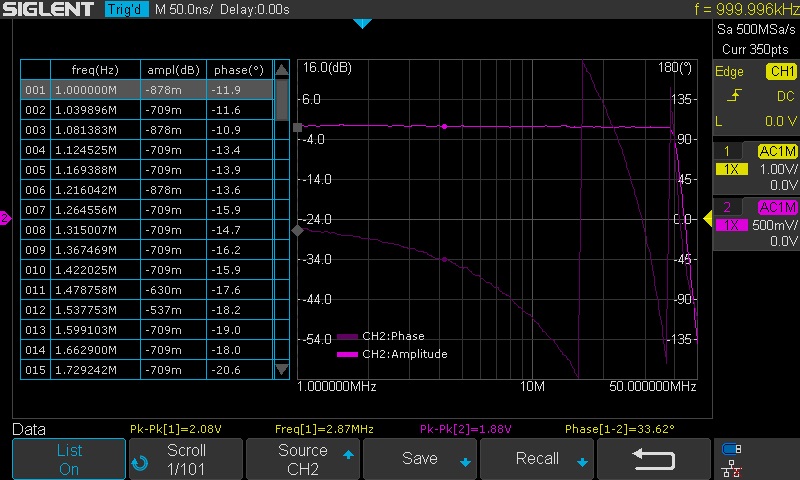
And scroll through each data point:
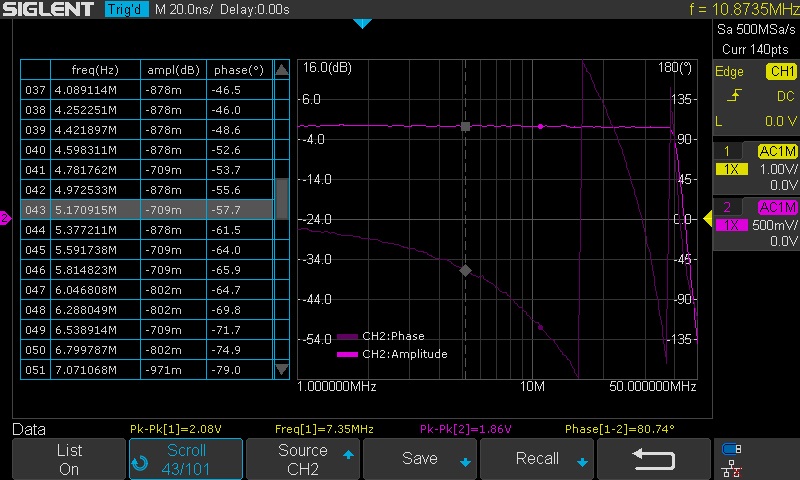
From here, you can use the scroll and cursors to find individual data points, quick print display images to USB, and save CSV data to USB using the Save function.
The Time Domain:
At the beginning of this note, we explained briefly that you can manually collect the amplitude and phase information.
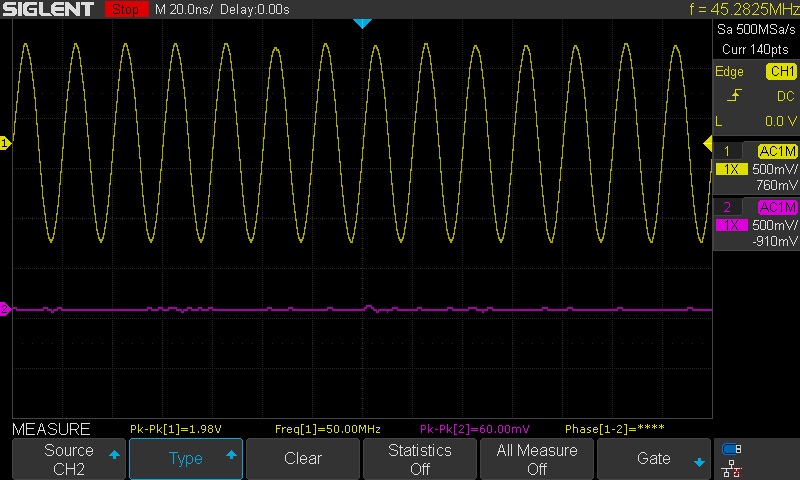
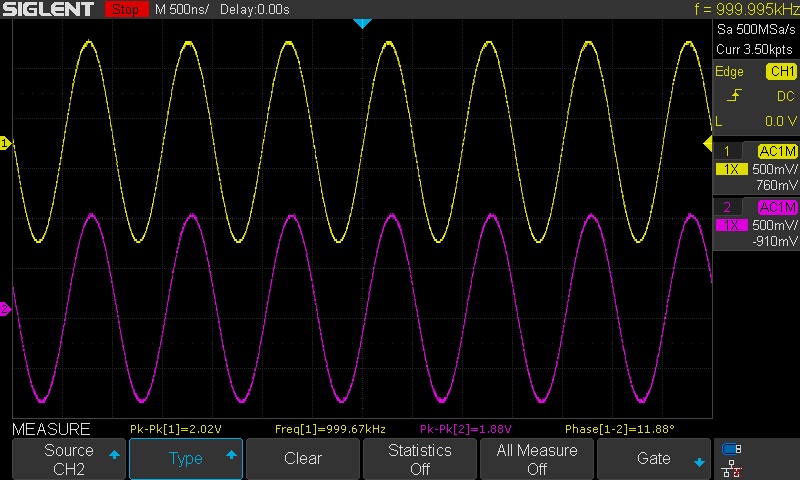
Here are a few oscilloscope frames captured manually sweeping and measuring the direct (CH1/Yellow) and through signals (CH2/Pink):
1 MHz:
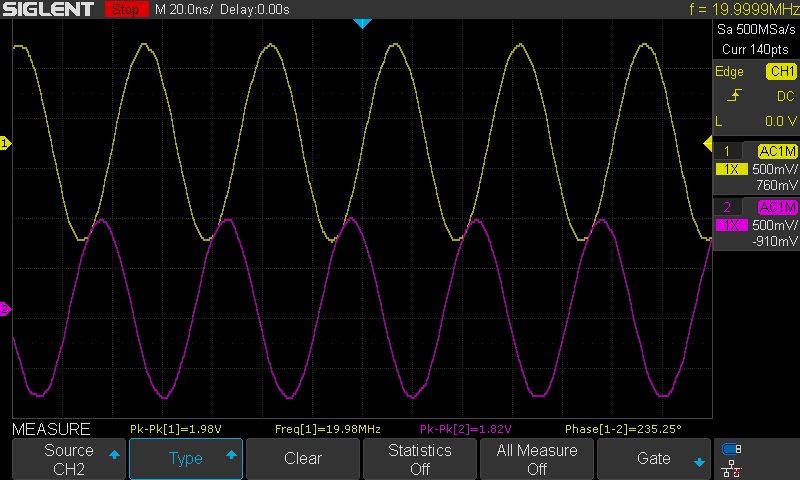
20 MHz (Note amplitude and phase changes):
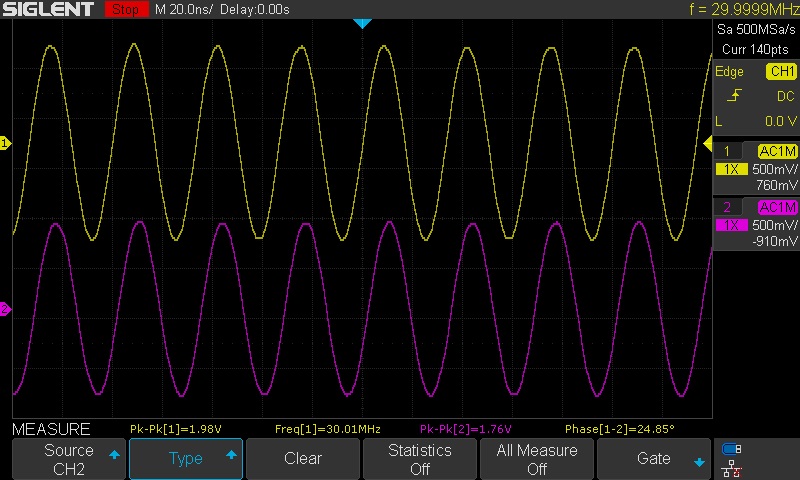
30 MHz:
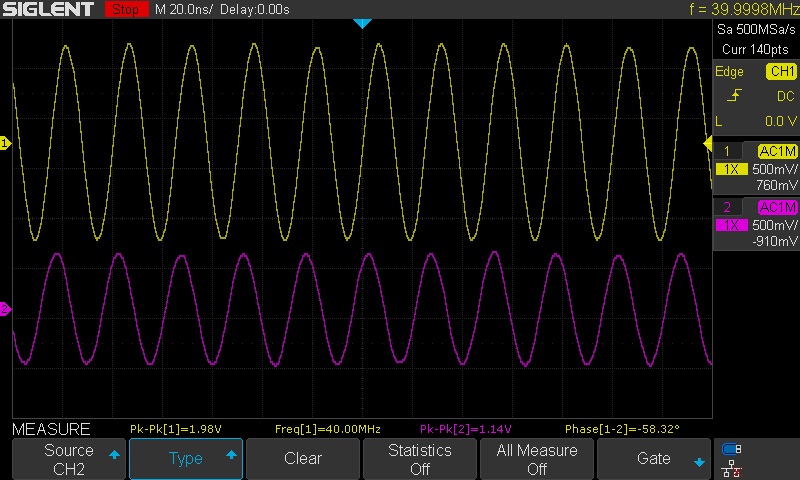
40 MHz:
Finally, we see 50 MHz.. and the through signal (through the filter) is severely attenuated.