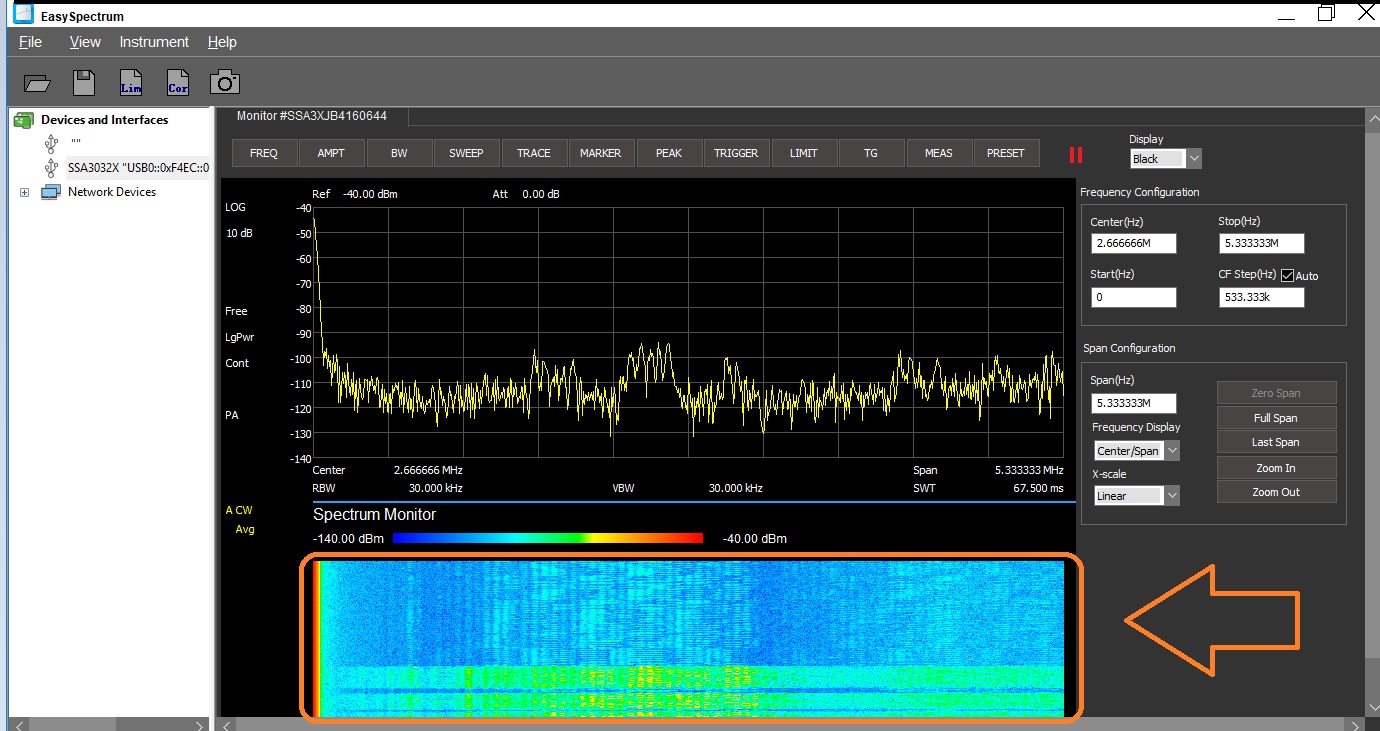
Spectrum Monitor (waterfall chart) in EasySpectrum software
December 18, 2018
SIGLENT EasySpectrum software includes a spectrum monitor mode that shows a waterfall chart of successive scans. This can be useful if you are observing a carrier signal for drift as well as comparing successive spectral scans.
To enable the spectrum monitor:
- Download EasySpectrum. Here is a link to the EasySpectrum Getting Started Guide
- Connect your SIGLENT analyzer to the controlling computer
- Open the EasySpectrum software
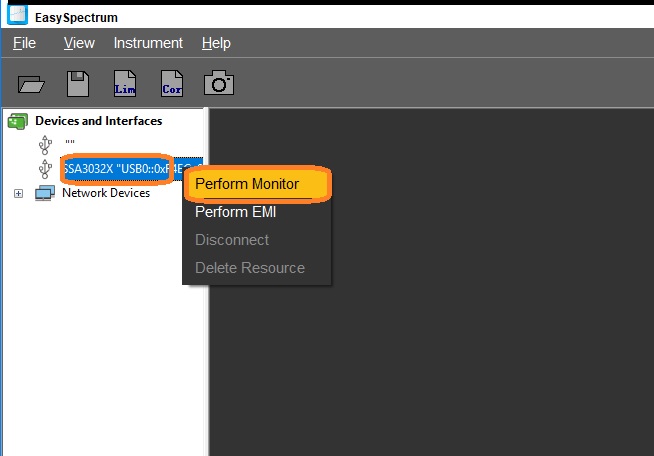
- Right-click to select the spectrum analyzer from the list (USB connection) or enter the LAN address and choose Monitor Mode
5. Configure the analyzer to view the span of interest
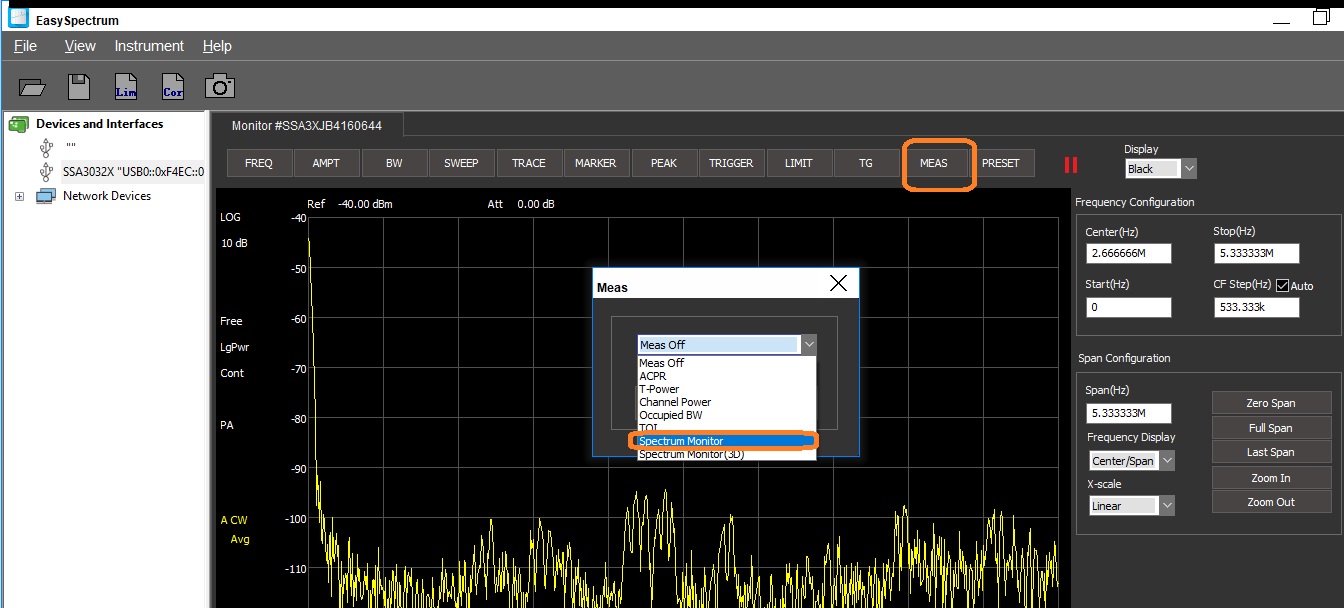
6. Select MEAS, open the drop-down box, and select Spectrum Monitor
7. Now, successive scans will be shown building up from the bottom of the display as shown: