Spectrum Analyzer Basics: Bandwidth
October 25, 2017
Spectrum analyzers are useful tools for broadcast monitoring, RF component testing, and EMI troubleshooting. There are a number of common adjustments available with many modern analyzers that can optimize performance for a particular application. In this application note, we will introduce resolution bandwidth (RBW) and video bandwidth (VBW) and how they affect measurements.
Resolution Bandwidth (RBW)
Bandwidth is defined as the span of frequencies that are the focus of a particular event. For example, the bandwidth of the transmission signal is the span of frequencies that the transmission occupies. The bandwidth of a measurement defines the range of frequencies that were used for the measurement.
In spectrum analysis, the resolution bandwidth (RBW) is defined as the frequency span of the final filter that is applied to the input signal. Smaller RBWs provide finer frequency resolution and the ability to differentiate signals that have frequencies that are closer together.
Why not use the smallest RBW setting for all measurements?
Sweep Time.
Sweep time is the length of time it takes to sweep the detector from the start to the stop frequency. Here is the equation governing the sweep speed:
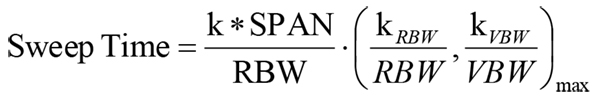
In this formula, the meaning of the first factor is the number of frequency selections under SPAN, each step is 1 / k of RBW, to ensure the accuracy of amplitude measurement. The second factor means that each selection The time required depends on the smaller value between RBW and video bandwidth (VBW). Usually, when we do not focus on noise, the VBW can be set to a value greater than or equal to RBW.
The time equation is reduced to:
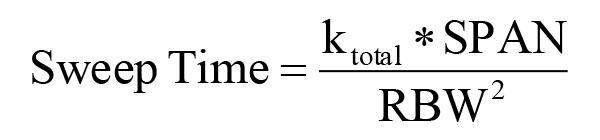
That is to say, the scanning time is proportional to SPAN and is inversely proportional to the square of RBW. This means that if the RBW is reduced by 100 times the scanning time will be increased by 10000 times in the same SPAN
Smaller RBWs also lower the noise floor, but they extended the sweep time for a given span of frequencies. Select a spectrum analyzer that has a large number of RBW settings, especially on the lower frequency end. You may not use 10 Hz RBW often, but it is very useful when you do. Adjustment is easy. Simply adjust the RBW to provide the proper balance between speed and resolution for your application.
Figure 1 is the measurement of two signals separated by 20 kHz. The traces were collected using RBWs of 30 kHz (Blue), 10 kHz (Yellow), and 3 kHz (Pink). Observe that while the frequency of these two similar signal measurement power is completely unchanged, the signal separation is only clear when the RBW is less than the frequency difference between the signals.
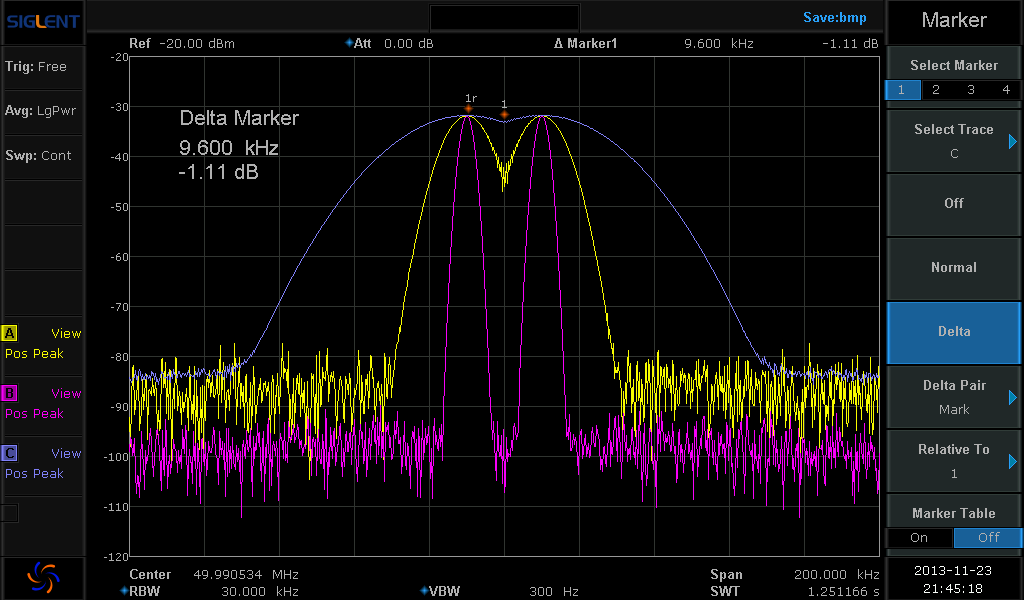
Figure 1: Spectrum analyzer display showing two signals at three different resolution bandwidth (RBW) settings.
Shape and Shape Factor
The shape and shape factor of the RBW filter can also be an important selection. Many analyzers have an RBW filter that has a Gaussian shape and a shape factor determined at the 3 dB point. The RBW value is the bandpass frequency of the filter 3 dB below the peak response of the filter. Recall that 3 dB is equal to 50% of the maximum. This is also referred to as the filter’s Full-Width -Half-Max (FWHM) value. The 3 dB Gaussian filter is acceptable for many measurements, but for Electromagnetic Compliance (EMC) related measurements, a filter defined at 6 dB may be required.
The shape factor of a filter is the ratio of the response at two attenuation values. Typically, the highest attenuation is measured at 60 dB down. The lower attenuation value is either 3 or 6 dB down. It is a measure of the sharpness of the filter response. If the ratio is large, the filter is not very “sharp”. This indicates that the filter spreads out over a large frequency range. If the ratio is small, this indicates a skinnier filter shape and sharper roll-off. This aids in rejecting more out-of-band signals because they don’t “bleed” over. Figure 2 shows how the shape factors for both the 3 dB and 6 dB points are calculated for a given filter. For spectrum analyzers, the 3 and 6 dB shape factors are similar, but the 6 dB filter has a steeper curve and has higher out-of-band rejection.
Shape Factor @ 3/60dB = (F6 – F1)/(F4-F3)
Shape Factor @ 6/60dB = (F6 – F1)/(F5-F2)
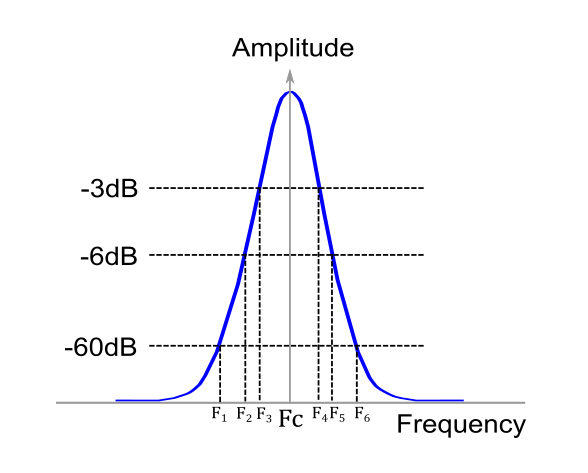
Figure 2: Gaussian filter showing 3, 6, and 60 dB points and center Frequency (Fc).
Phase Noise
Another factor that affects the frequency resolution of an analyzer is the phase noise. This is observed as a widening and increase in the noise amplitude near the center frequency of the signal (figure 3). It is caused by the random thermal fluctuations of the oscillator used as a timing reference in the spectrum analyzer circuitry. These fluctuations cause the phase of the output clock signal to vary with time, very similar to jitter in a time-based system. This widening can cover up any small signals that may be near the frequency of interest. For meaningful measurements, select an instrument with lower phase noise than the signal source you are measuring.
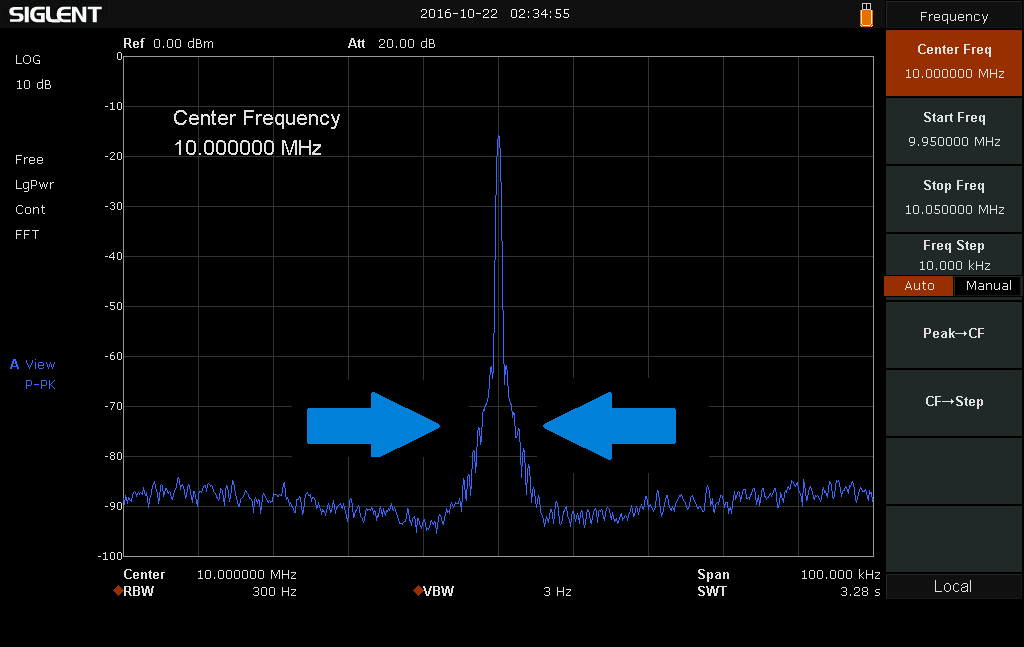
Figure 3: Spectrum analyzer display showing phase noise effects of an input signal
Video Bandwidth (VBW)
Another factor that affects the displayed trace quality of a spectrum analyzer is the video bandwidth (VBW). Video filtering is a time-domain low-pass filter, mathematically equivalent to the mean or average. The main effect of the VBW filter is to smooth the trace and decrease noise.
Strictly speaking, the VBW does not change the measurement results. It will not affect the “frequency selection, peak detection” of the measurement process. The VBW filter is applied after the data has been collected, but before the screen displays the trace. As can be seen from figure 4 below, when the VBW is large, noise makes small-signal observation difficult. If we reduce the VBW, the small signal becomes much more clear.
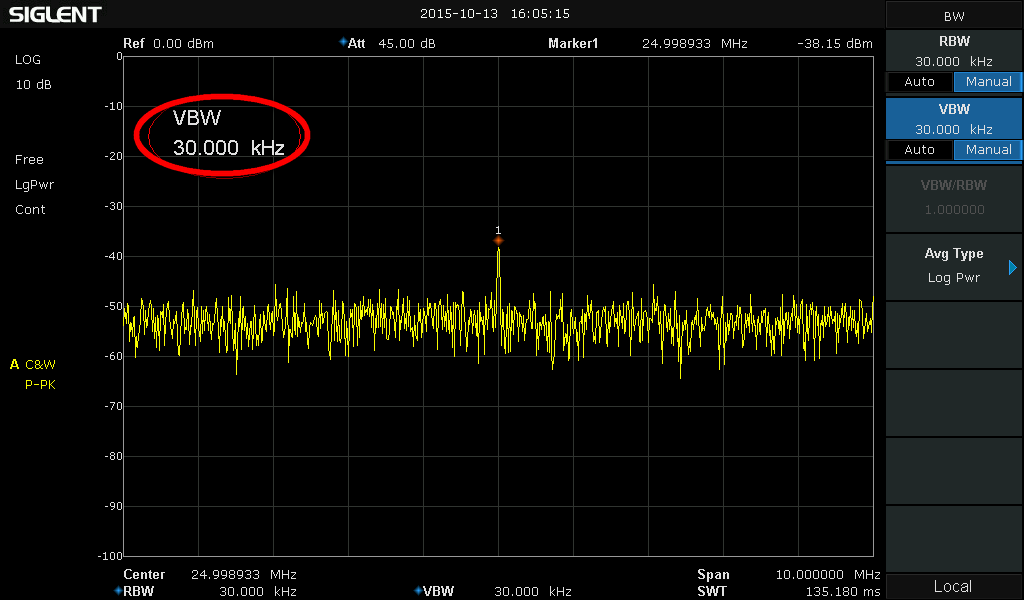
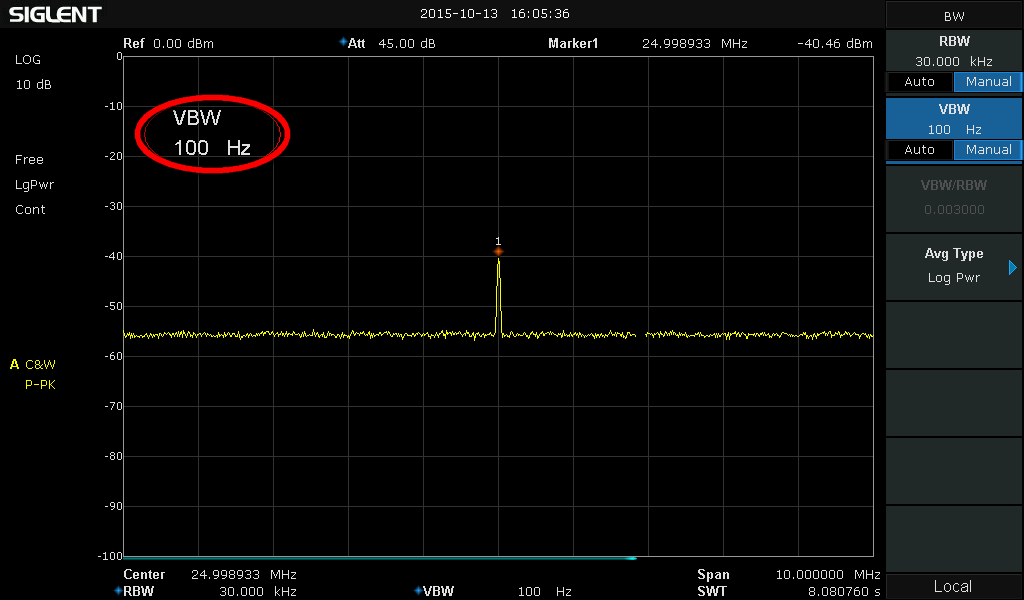
Figure 2: Smoothing effect of random signal with different VBW
Conclusions
Modern spectrum analyzers offer flexible measurement capabilities. Select an analyzer that provides an adjustable RBW/VBW (lower is better), lower phase noise than the signal you are testing. Adjusting the RBW can provide lower noise floor and fine frequency resolution, but the sweep time will increase dramatically. For noisy signals, you can lower the VBW to help smooth the trace and make signal identification easier, but this will also increase sweep time. If you are performing EMI measurements, a 6dB sharper filter option is required to increase peak detection accuracy.